A single bass drop can send hundreds of digital particles flying across a screen, while a soft piano melody creates gentle waves of color. But those animations are not random. They are controlled by mathematical measurements extracted from music. So, how do music visualizer apps respond to sound so accurately?
These applications capture audio signals, measure characteristics such as loudness and frequency, and translate the results into moving graphics. Using techniques such as Fast Fourier Transform (FFT), they can make shapes pulse, colors shift, and animations follow musical changes almost instantly.
Understanding this process helps musicians, video creators, DJs, and beginners produce visuals that genuinely complement their music.
What Happens Between the Sound and the Screen?
Music visualizers operate through a continuous cycle of audio processing and graphic rendering.
Instead of interpreting music emotionally, software identifies measurable changes in the sound signal. Those measurements become instructions for visual effects.
Step 1: Capturing the Audio Signal
Every visualization begins with an audio source. Depending on the application, that source might be a recorded song, microphone, DJ controller, media player, or compatible system-audio feed.
The software receives digital audio samples representing changes in the sound waveform.
According to the Library of Congress, digital audio quality depends partly on how sound is represented and sampled. For visualizers, this digital information provides the foundation for measuring musical activity.
Step 2: Identifying Loudness and Frequencies
Once the audio enters the application, an analysis engine examines its characteristics.
Two particularly important measurements are:
- Amplitude: Indicates signal strength and helps graphics respond to loudness.
- Frequency: Describes how quickly sound vibrations repeat and helps distinguish low and high tones.
Many applications use FFT to convert short sections of audio into frequency information.
The University of California, Irvine explains that FFT transforms sound represented over time into its frequency spectrum.
This allows visualizers to distinguish bass-heavy passages from sounds dominated by higher frequencies.
Step 3: Converting Measurements Into Animation
The application connects audio measurements to visual properties. And has become an important feature for virtual reality technology change live music experiences.
For example, a designer might configure:
- Bass intensity to increase the size of a glowing circle.
- Midrange energy to control rotating geometric shapes.
- Treble activity to trigger sparkling particles.
- Sudden volume changes to create flashes or expanding rings.
These connections are called audio-reactive mappings.
The software repeatedly updates these measurements and redraws the graphics, creating the impression that the images are moving with the music.
Why Do Different Instruments Create Different Visual Effects?
Most musical instruments produce combinations of frequencies rather than one isolated tone.
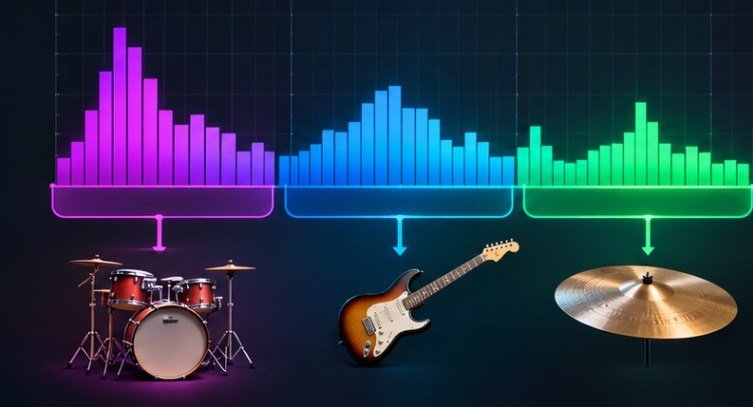
A kick drum often concentrates substantial energy in lower frequencies, while cymbals contain considerable high-frequency energy. A visualizer can respond differently to these ranges.
Bass, Midrange, and Treble Responses
Low frequencies commonly control large, slower-looking movements, including expanding circles and screen pulses.
Midrange frequencies can influence geometric patterns, animated waves, or changes in object size.
Higher frequencies often drive smaller, sharper effects such as flickering lights and particle bursts.
However, these relationships are design choices, not fixed scientific rules. Developers can assign any frequency range to almost any graphic property.
How Does Beat Detection Improve Synchronization?
Frequency analysis alone does not guarantee accurate beat synchronization.
Some applications also detect onsets, which are moments when musical events begin or signal energy rises sharply.
An onset detector can identify a sudden drum attack and trigger an animation at that moment.
The World Wide Web Consortium’s Web Audio specification describes the underlying analysis capabilities used in browser-based audio applications.
More advanced systems may combine onset detection, tempo estimation, and rhythmic tracking to produce coordinated motion.
Popular Types of Music Visualizers and Their Uses
Not every visualization presents audio information in the same way.
Waveform and Spectrum Displays
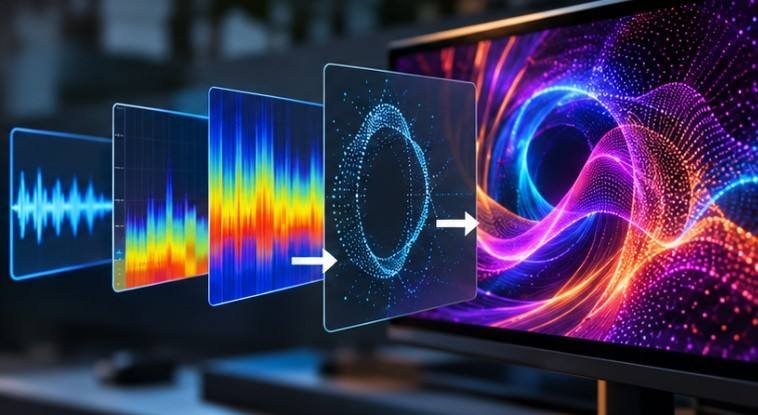
Waveform visualizers show changes in audio amplitude over time. They work well for podcasts, voice recordings, and minimalist music videos.
Spectrum visualizers divide audio into frequency ranges, often displaying moving bars.
These are particularly useful for electronic music and live DJ performances.
Circular and Particle-Based Animations
Circular visualizers arrange bars, lines, or waves around a central shape.
Particle systems create more expressive effects by connecting audio measurements to movement, brightness, or particle density.
For example, an electronic track might trigger expanding particles during a chorus while maintaining subtle movement during quieter sections.
Three-Dimensional and Generative Visuals
Advanced visualizers use virtual cameras, 3D objects, shaders, and procedural graphics.
Some incorporate AI-generated imagery, although the audio-reactive behavior may still depend on traditional signal analysis.
These tools suit immersive performances and experimental music productions but typically require more processing power.
Live Visualizers vs. Pre-Rendered Music Videos

The biggest difference involves when the graphics are generated. A live visualizer analyzes incoming audio while the music plays. It must process information quickly enough to maintain synchronization.
A pre-rendered visualizer analyzes an audio file before exporting the finished video. Pre-rendering allows creators to refine timing, add detailed effects, and produce complex animations without depending entirely on live performance.
For beginners making YouTube music videos, pre-rendered output often provides greater creative control. Live systems are more useful for concerts, DJ streams, and interactive installations.
Audio-Reactive Graphics vs. MIDI-Controlled Visuals
Audio and MIDI can both control animations, but they provide different information.
Audio-reactive systems examine actual recorded sound. They respond to the combined signal, including instruments, vocals, and effects.
MIDI-based visualizers receive performance instructions such as note events, velocity, and controller changes.
Consequently, MIDI can trigger a precise visual response whenever a particular note is played.
Audio analysis is more flexible for finished recordings, while MIDI offers direct control during compatible electronic performances. Creators can also combine both methods for more predictable results.
Frequently Asked Questions
1. How do music visualizer apps respond to sound in real time?
They continuously capture audio, calculate measurements such as amplitude and frequency energy, and update graphics using those measurements. Rendering speed and audio-processing latency influence how quickly animations respond.
2. Can music visualizers work without a microphone?
Yes. Many applications analyze imported audio files, compatible media playback, or system audio directly. Microphones are mainly necessary when capturing external sounds.
3. Do music visualizers recognize individual instruments?
Basic visualizers usually analyze combined frequencies. Advanced systems may use source separation or machine learning to estimate individual instruments and create more selective animations.
4. Are music visualizer apps suitable for beginners?
Yes. Preset-based applications can generate responsive waveforms and spectrum animations with minimal configuration. Beginners should prioritize straightforward controls, synchronization, and export quality.
The Real Secret Behind Music That Moves
A compelling music visualizer is more than a screen filled with synchronized colors. It is a carefully designed relationship between measurable sound characteristics and artistic movement.
The underlying technology can detect loudness, frequencies, and rhythmic changes, but creators decide how those measurements become meaningful visual experiences.
I recommend beginning with a simple waveform or spectrum display, testing it with different recordings, and gradually introducing frequency-specific effects.
The most memorable visualizations do not react dramatically to every sound. They respond selectively, creating movement that feels connected to the music rather than competing with it.