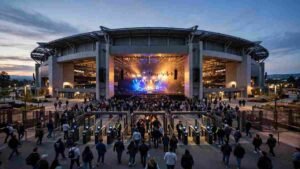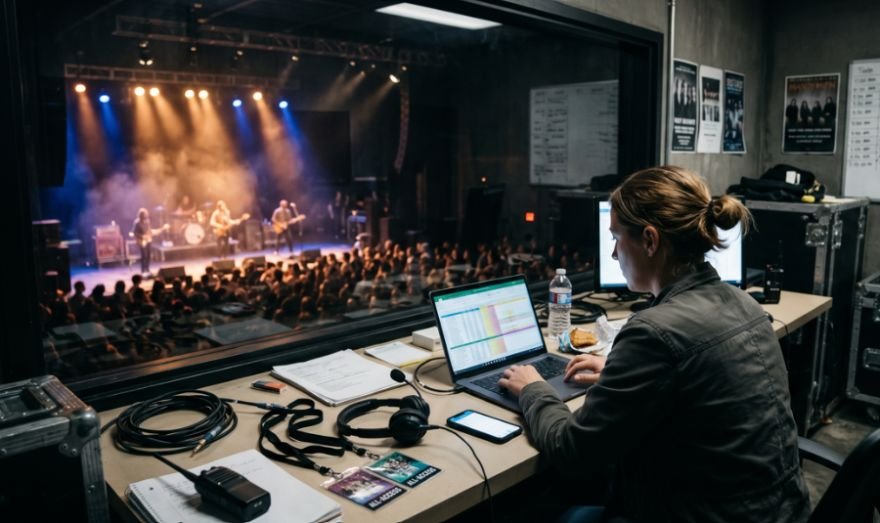
When I first started booking mid-sized club and theater runs across the Midwest, I thought ticket pricing was simple: add up the band’s fee, divide by the room’s capacity, and tack on a small markup.
That naive formula nearly bankrupted me on a 900-capacity show in Chicago when comp lists, production kills, and performance royalties ate my entire margin before doors even opened. Understanding how concert promoters budget and price live tour tickets comes down to one rule: you never price for a sell-out—you work backward from a conservative break-even target.
Because independent promoters shoulder 100% of the upfront financial risk, every tour date begins with a “pro forma” profit-and-loss sheet long before a single presale link goes live.
Why Promoters Work Backward From the Break-Even Point
If a show requires selling 90% of the room just to cover expenses, you are gambling, not promoting. Experienced talent buyers stress-test every pro forma budget so the event breaks even between 55% and 75% of sellable capacity.
When my initial math pushes the break-even threshold past 75%, I pull one of three levers before signing the deal:
- Renegotiate the guarantee: Shift the artist from a high fixed fee toward backend upside.
- Adjust the house scaling: Raise top-tier VIP or front-row prices without pricing out the back of the room.
- Downsize the venue: Move from a 1,500-cap theater to an 800-cap club to compress fixed room overhead.
Building the Six-Line Concert Cost Stack

Before you can determine a ticket’s face value, you must lock down every fixed and variable expense on the show’s P&L. I organize my pro forma budgets into six non-negotiable categories.
Talent Guarantees and Versus Deals
Artist compensation typically consumes 50% to 70% of a show’s total budget. Booking agents generally negotiate one of two structures: a flat guarantee (a fixed dollar payout regardless of ticket sales) or a versus deal.
Under a standard versus deal, the artist receives either their guaranteed minimum or 80% to 85% of net box office receipts after approved show expenses, whichever is higher. Understanding how touring artists and live music venues structure revenue-sharing agreements helps protect artists when weather or competing local events reduce walk-up sales while allowing them to benefit when the venue sells out.
Production, Venue Ops, and Hidden PRO Royalties
Beyond talent, five operational cost buckets decide whether your show stays in the black:
- Production and Riders: Sound reinforcement, lighting rigs, backline rentals, stagehands, and hospitality catering. According to U.S. Bureau of Labor Statistics performing arts benchmarks, skilled technical crew labor remains one of the fastest-rising line items in live production.
- Venue Rent and Operations: Base room rental, union security minimums, barricades, EMT medical coverage, and event liability insurance.
- Marketing Spend: Paid Meta and TikTok geo-targeted ads, local radio buys, and street-team postering concentrated around the announce, on-sale, and final two weeks.
- Ticketing and Merchant Fees: Box office software commissions, credit card processing (typically 2.9% to 3.5%), and chargeback reserves.
- Taxes and Music Royalties: State amusement taxes plus mandatory public performance licenses from ASCAP and BMI. Even if an indie band plays 100% original songs, the promoter or venue must hold valid PRO blanket coverage—typically running 0.3% to 0.8% of net ticket receipts.
Calculating Sellable Capacity and Net Ticket Revenue
Rookie promoters make two fatal math errors: dividing fixed costs by advertised venue capacity and calculating revenue from the ticket’s gross face value.
First, you must strip away non-sellable inventory. On a 1,200-capacity theater, I routinely subtract 40 artist and sponsor comps, 20 ADA holds, and 30 “production kills” (seats blocked by the front-of-house soundboard and camera risers). Your true sellable capacity is 1,110 tickets, not 1,200.
Second, you calculate Net Revenue Per Ticket by deducting state sales taxes, venue facility fees, and PRO royalties from the gross ticket price.
Break-EvenTickets=TotalFixedShowCostsNetRevenuePerTicket
Worked Example: Pro Forma Budget for a 1,200-Cap US Theater
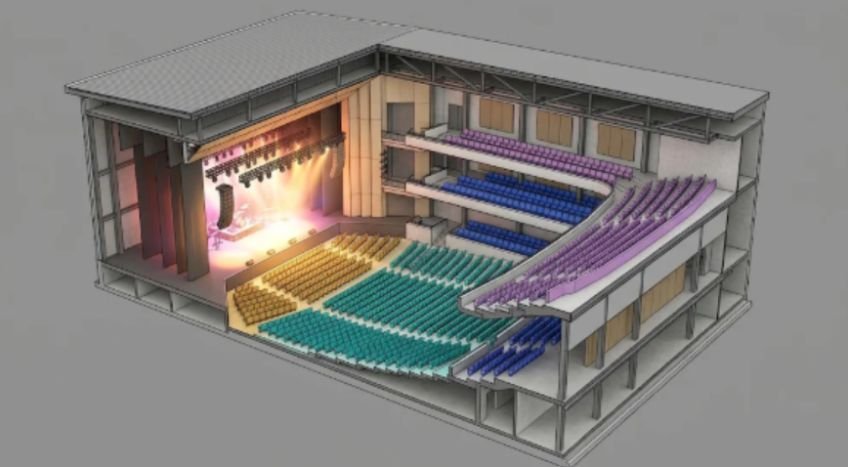
To show how these numbers interact in the real world, here is the exact pro forma model I use when evaluating a mid-tier touring rock act in a 1,200-capacity US theater (1,110 sellable tickets after comps and kills):
| Budget Line Item | Amount / Rate | Notes & Accounting Impact |
| Artist Guarantee | $18,000 | Structured as $18,000 vs. 85% of net after expenses |
| Production & Hospitality | $4,200 | Local audio/lighting package, stagehands, and catering |
| Venue Rent & Security | $3,800 | Flat room lease, 12 security guards, and EMT coverage |
| Marketing & PR | $2,500 | Geo-targeted social ads, local press, and poster runs |
| PRO Licensing & Insurance | $850 | ASCAP/BMI event fees and $2M general liability policy |
| Total Fixed Show Costs | $29,350 | Must be covered before any backend split triggers |
If my target average net ticket price is $42.00 (after stripping a $3.00 venue facility fee and 7% local sales tax from a $48.35 all-in face value), my break-even math looks like this:
- Break-Even Point: $\$29,350 \div \$42.00 = \mathbf{699\text{ tickets}}$ (63% of sellable capacity).
- Gross Potential at 100% Sell-Out (1,110 tickets): $\$46,620$ Net Box Office Receipts (NBOR).
- Split Point & Settlement: After subtracting $\$29,350$ in fixed costs and a 15% promoter profit buffer ($\$4,402$), the remaining net pool is $\$12,868$. Because 85% of the net pool ($\$10,938$) is lower than the artist’s $\$18,000$ guarantee, the artist walks away with their $\$18,000$ guarantee and I clear $\$12,868$ at the box office.
Scaling the House vs. Dynamic Pricing Under FTC All-In Rules
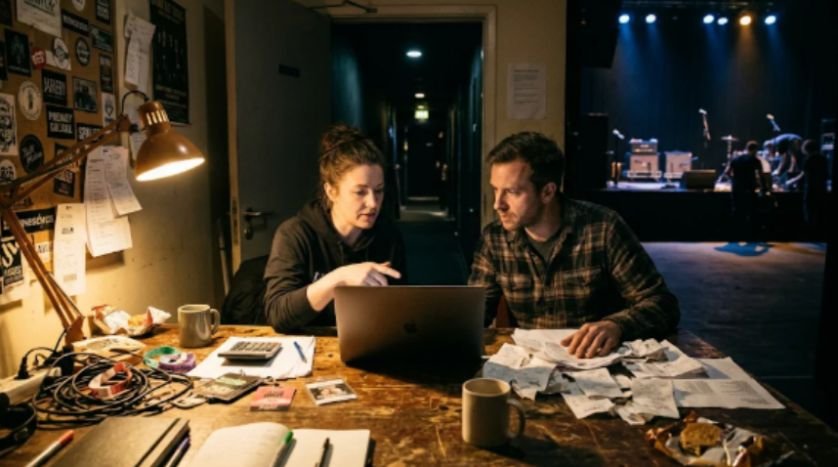
Once my pro forma gives me a baseline average price of $48.35, I never slap a single flat price on every seat. A flat price leaves money on the table in the front rows while leaving the upper balcony half-empty. Furthermore, under the Federal Trade Commission’s Junk Fees Rule, US promoters must display the all-in ticket price—including mandatory facility and processing fees—from the very first screen.
Tiered House Scaling for Predictable Gross Potential
I start by “scaling the house” into four transparent sightline tiers:
- P1 – Front Pit / First 5 Rows (150 seats @ $75 all-in): Captures superfans willing to pay for proximity.
- P2 – Center Orchestra / Lower Bowl (360 seats @ $55 all-in): The core margin engine of the room.
- P3 – Rear Orchestra / Front Balcony (400 seats @ $40 all-in): Volume seats priced near the market reference point.
- P4 – Upper Balcony Sides (200 seats @ $30 all-in): Entry-level tickets that ensure the room looks full on camera.
Ring-Fenced Dynamic Pricing and VIP Bundles
If an artist’s presale queue surges past 3,000 fans for a 1,110-seat room, underpricing the front rows simply hands free profit to secondary-market scalpers. However, unleashing unchecked dynamic pricing across the whole venue triggers brutal fan backlash.
Instead, I ring-fence 85% to 90% of the room at fixed house-scaled prices and apply dynamic “Platinum” pricing strictly to the top 10% of aisle and front-center seats—always enforcing a hard price floor so early buyers are never undercut.
Better yet, I bundle prime seats with soundcheck access and signed posters into fixed-price VIP packages, giving superfans tangible value instead of a surge penalty. Understanding how niche music ecosystems monetize audience attention—much like how independent music blogs and media outlets generate revenue through tiered memberships rather than intrusive paywalls—helps promoters design VIP tiers fans actually celebrate.
Night-of-Show Settlement: Where Razor-Thin Margins Live
Thirty minutes after the headliner takes the stage, I sit down in the production office with the tour manager to run the night-of-show settlement. We audit the final box office drop, verify every signed invoice for stagehands and catering, deduct taxes and facility fees, and sign off on the final wire.
On competitive club and theater tours, pure ticket margins frequently hover between 10% and 15%. Many nights, the box office merely pays the bills, and my real profit comes from secondary revenue streams negotiated into the venue lease—specifically a 15% to 25% cut of bar sales or a negotiated commission on artist merchandise.
Frequently Asked Questions
1. What is a healthy break-even target for a live concert budget?
Most experienced promoters aim to break even at 55% to 65% of genuinely sellable venue capacity, treating anything above 75% as high financial risk.
2. How do promoters handle comp tickets when pricing a tour?
Promoters subtract artist guest lists, sponsor allocations, and production kills from total room capacity before dividing fixed costs across remaining sellable seats.
3. Do concert promoters have to pay ASCAP and BMI fees for original bands?
Yes, promoters or venues must pay public performance royalties to PROs like ASCAP and BMI whenever copyrighted music is played publicly, even if the performing artist wrote every song.
4. What is the difference between house scaling and dynamic pricing?
House scaling assigns fixed prices to specific seating zones before tickets go on sale, whereas dynamic pricing uses real-time demand algorithms to fluctuate seat prices during the on-sale.
Stop Guessing the Gate and Start Stress-Testing Your Split Point
Blindly copying last year’s ticket prices is the fastest way to lose your shirt in live music. Before you send your next offer sheet, build a three-scenario pro forma spreadsheet modeling 60%, 80%, and 100% sellable capacity with all-in FTC fees and PRO royalties baked into the expense stack.
Open your spreadsheet right now, strip out your comps and production kills, and check where your true break-even line sits—if it takes more than two-thirds of the room just to pay the band, restructure the deal before you announce the tour.